Ah, stats! Everyone loves them.. the media, start-ups…especially the fast-growing ones, those that keep telling us how great everything is. 1 million downloads of their app, 200,000 tweets per day, 20 million registered users … But, really, what do these figures really give us?
Out of context, without parameters, they can quickly appear to be meaningless. A downloaded application is not necessarily a used application, talking about a product or an online solution does not necessarily generate positive engagement, and registered users may not be active users.
It’s what Eric Reis calls “vanity metrics” – useless data that does nothing but makes us happy. The opposite being “real metrics”, which are the key indicators as to how our business is doing.
Rather than being addicted to Google Analytic tables, in this article, we’ll go through what we consider to be “vanity metrics” and our advice on how to turn them into actionable statistics and an overview of some of our marketing indicators.
1. Vanity Metrics: what are they and why should they be avoided
If we need to give a definition, vanity metrics are indicators that reassure you, but are not actionable nor comparable. Vanity metrics are easy to handle and are not useful for your business because you cannot draw any conclusions from them.
As Tim Ferris said :
“Vanity metrics : good for feeling awesome, bad for action.
Vanity metrics give you the sense that everything is going well, but they aren’t reliable.
More than that though, if you do start to use them as valuable indicators, it will be harmful to you in the long run.

If for example, you observe a huge peak in the number of visits in February (and keep this indicator in mind only), your reaction will be 1) to tell you that it is great and 2) to tell you that you must reproduce what happened before. However:
- do you know exactly where this peak visit came from?
- do you know who the visitors are?
- do you know why you didn’t get the same thing in March? Or why they weren’t the same level in January?
- what did you do with those visits?
If you can’t answer these questions, chances are the number of visits to your site is merely window dressing.
So, how do you get indicators that are really useful?
1.1 What is a “real metric”?
There are always counter-examples, but if your indicator is a ratio or a rate, you are probably heading in the right direction. A ratio or rate is a question of comparison: you correlate two data to enrich and understand them better.
For example, rather than the number of visits to your site, what about the number of visits….
- … by audience? This ratio would allow you to know more about your visitors and adjust your content accordingly.
- … by source? This ratio would allow you to better identify where your visitors come from and if your marketing campaigns are more or less effective.
In general, a good indicator is understandable and comparative: the ability to measure one indicator to another, or to your competitors, means you to have a real vision.
An indicator is rarely one number alone, its value comes from the comparison and how it grows. Saying “our conversion rate is above our average conversion rate” has more power – and use – than saying “we convert 2% of our visitors”! (Even if the latter feels good)
How to make sure you’re following the right metrics
Good indicators are those that can be linked to user behaviour or to the success of your business.
For example, knowing the number of customer acquisition is only useful when it is linked to
- information on their user behaviour (such as where they are in the marketing funnel) ;
- information on their cost and their potential purchasing power (like working out customer acquisition cost)
If you can find out the figures on this, you have something like a real metric.
You can probably take some of your current indicators to make them more useful. Such as,
- Number of page views can become conversion rate of your website
- Likes on social media can become mentions or engagements on social media
- Number of newsletter subscriptions can become newsletter conversion rate
- Number of customers acquired can become the cost of customer acquisition
Certainly, vanity metrics can be helpful for convincing management or reassuring a customer, but as a marketer, statistics need to help you ask the right questions.
A budget that increases on a campaign is, for example, unusable data by itself, while increasing the cost of customer acquisition shows that we can adjust a strategy: act on the ad, better target its audience …
Some examples of KPI’s to follow in inbound marketing
We asked our marketing team what their favourite indicators were and which they consistently follow day by day.
Adeline, Marketing Manager
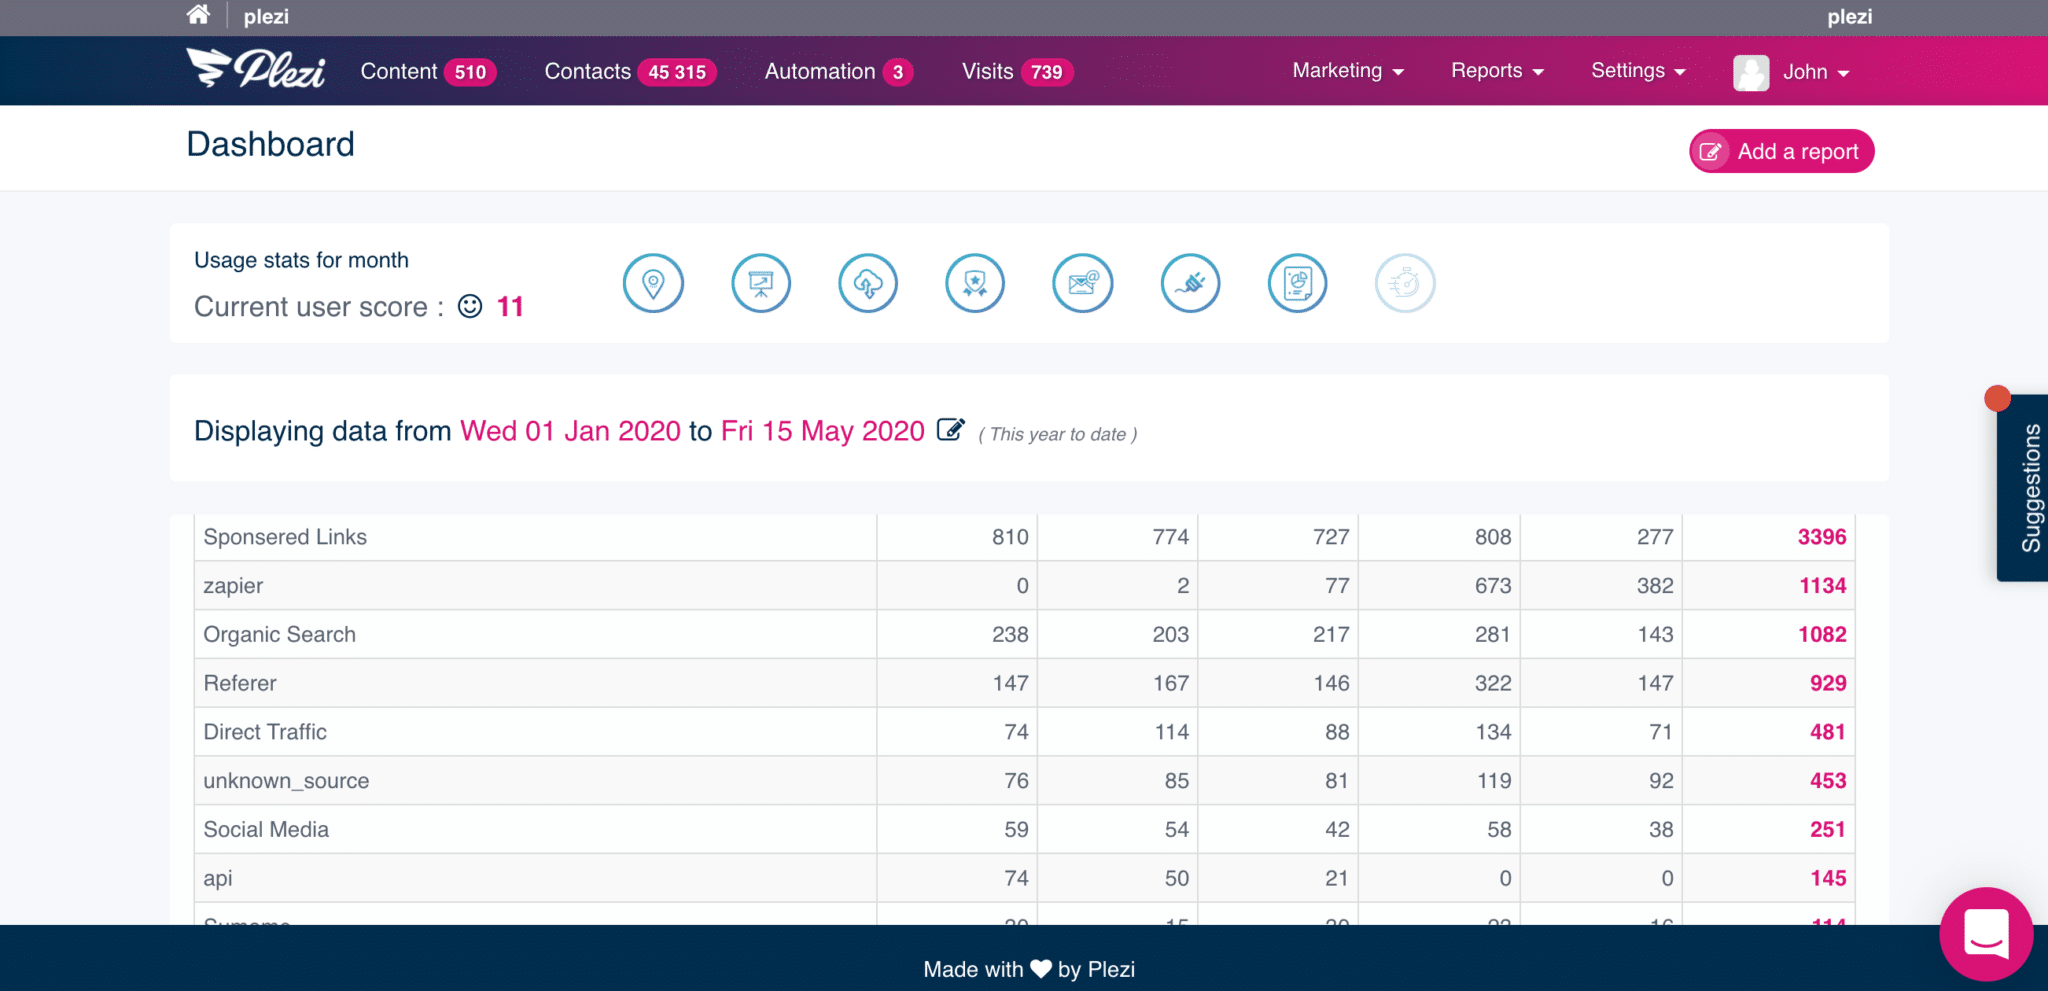
Leads and MQL by source
Why: so I can know what source generates the most leads and MQL’s, to better manage the marketing strategy overall.
Which tool : Plezi, of course 😉
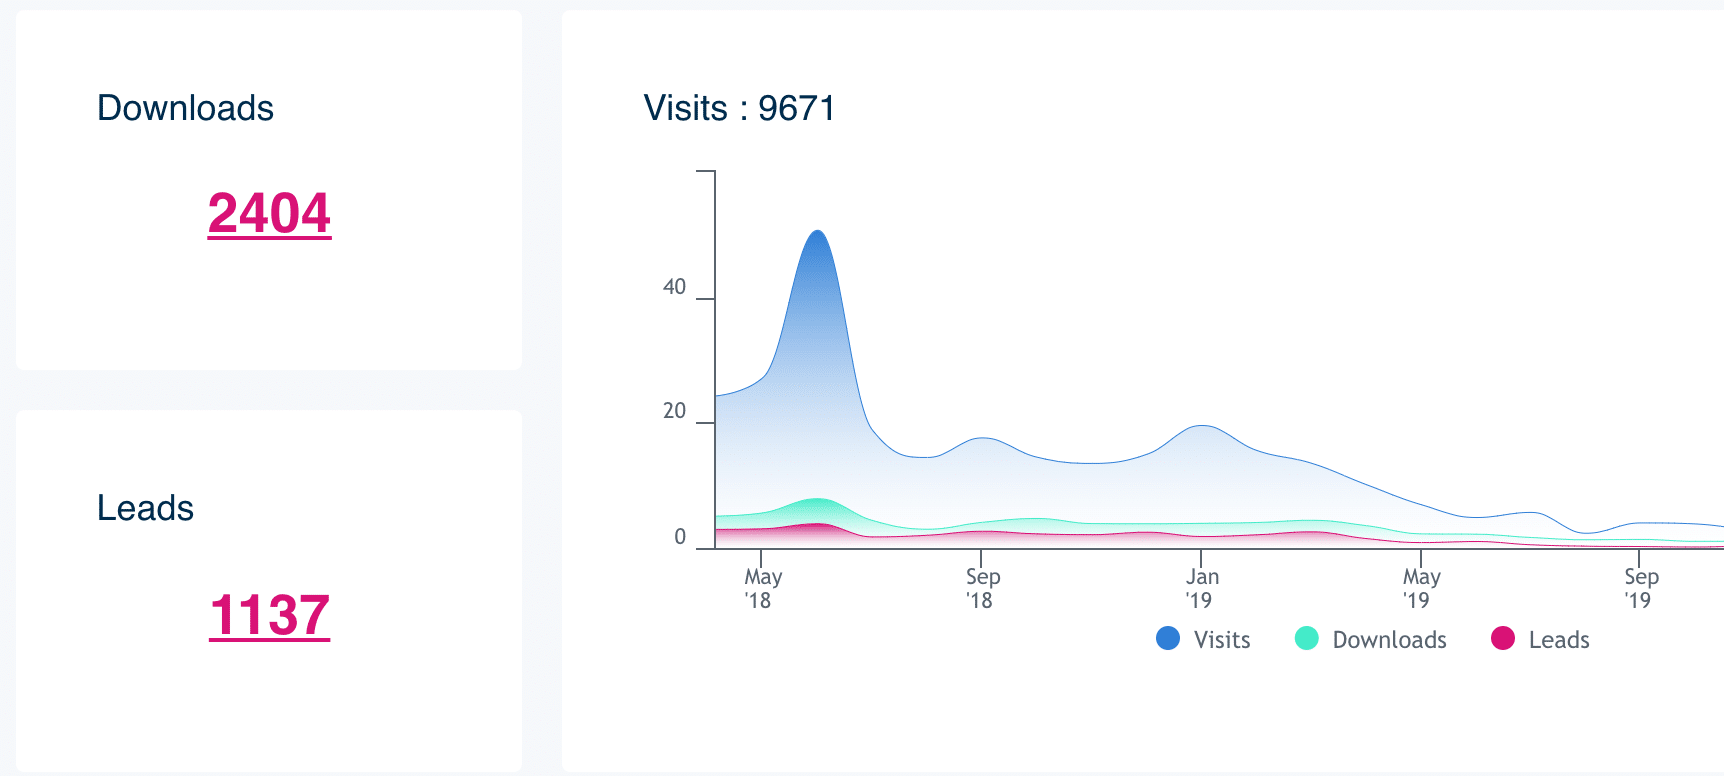
 Number of download and leads per content
Why: so I can see the best performing content to adjust our content marketing strategy.
Which tool : Plezi
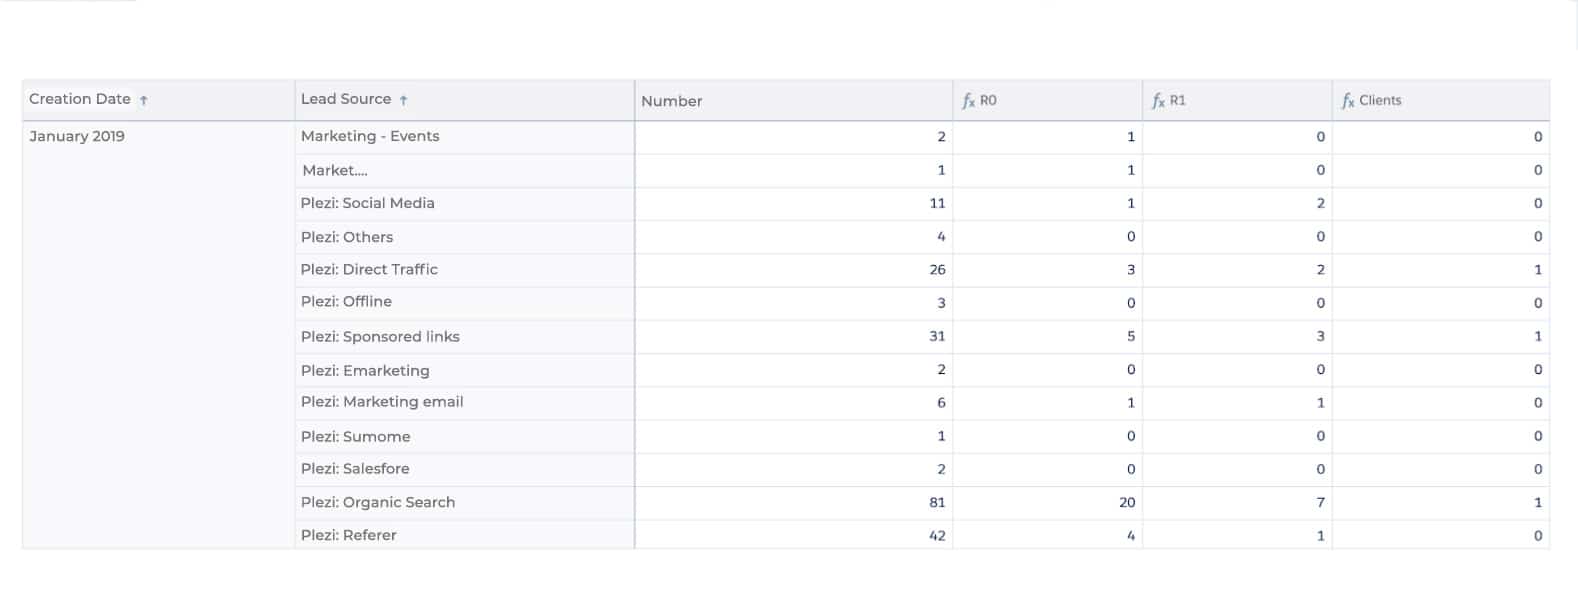
Conversion rate -MQL > SQL > Marketing customers
Why: so I can know which source generate the most customers and monitor our overall performance to better manage the budgets and actions of the marketing team.
Which tool: Salesforce
 Benoît, Growth Marketer
Number of leads per source by day
Why: it means you can see at a glance how healthy each source is through the different channels and is the starting point of all analysis
Which tool: Plezi, of course!
 Organic Traffic and organic keywords
Why: it enables you to see immediately if our SEO and content creation is working. Depending on the results, we can dig in by keyword and deepen our position and CTR (click-through rate) statistics.
Which tool: Ahrefs as a dashboard, Search Console to dig into the detail
 Kany, Traffic Manager
CTR (click-through rate, or click ratio) from our social media posts
Why: it allows us to have a very quick vision on the effectiveness of our message for our target market
Which tool: the paid accounts of each social media platform

CPA (cost-per-acquisition, or acquisition cost) of our sponsored campaigns
Why: we quickly see the profitability (and therefore the effectiveness) of our campaigns and also gives us a good overview of the interest points for people clicking on our messages.
Which tool: the paid accounts of each social media platform
Lisa, Brand Manager
Leads and conversion rate on social media
Why: you can find out which network generates the most prospects, and to adapt our digital strategy accordingly.
Which tool: Plezi, of course!
Social Media engagement rate
Why: this is the number of reactions (likes, comments, etc.) to the total number of views. We can understand the quality of our message, know if it interests our prospects or not, and change our strategy accordingly.
Which tool: Agorapulse
Post impression
Why: by comparing the number of impressions against the type of content, time of publication etc. you can see the best performing messages – and change accordingly
Which tool: Agorapulse
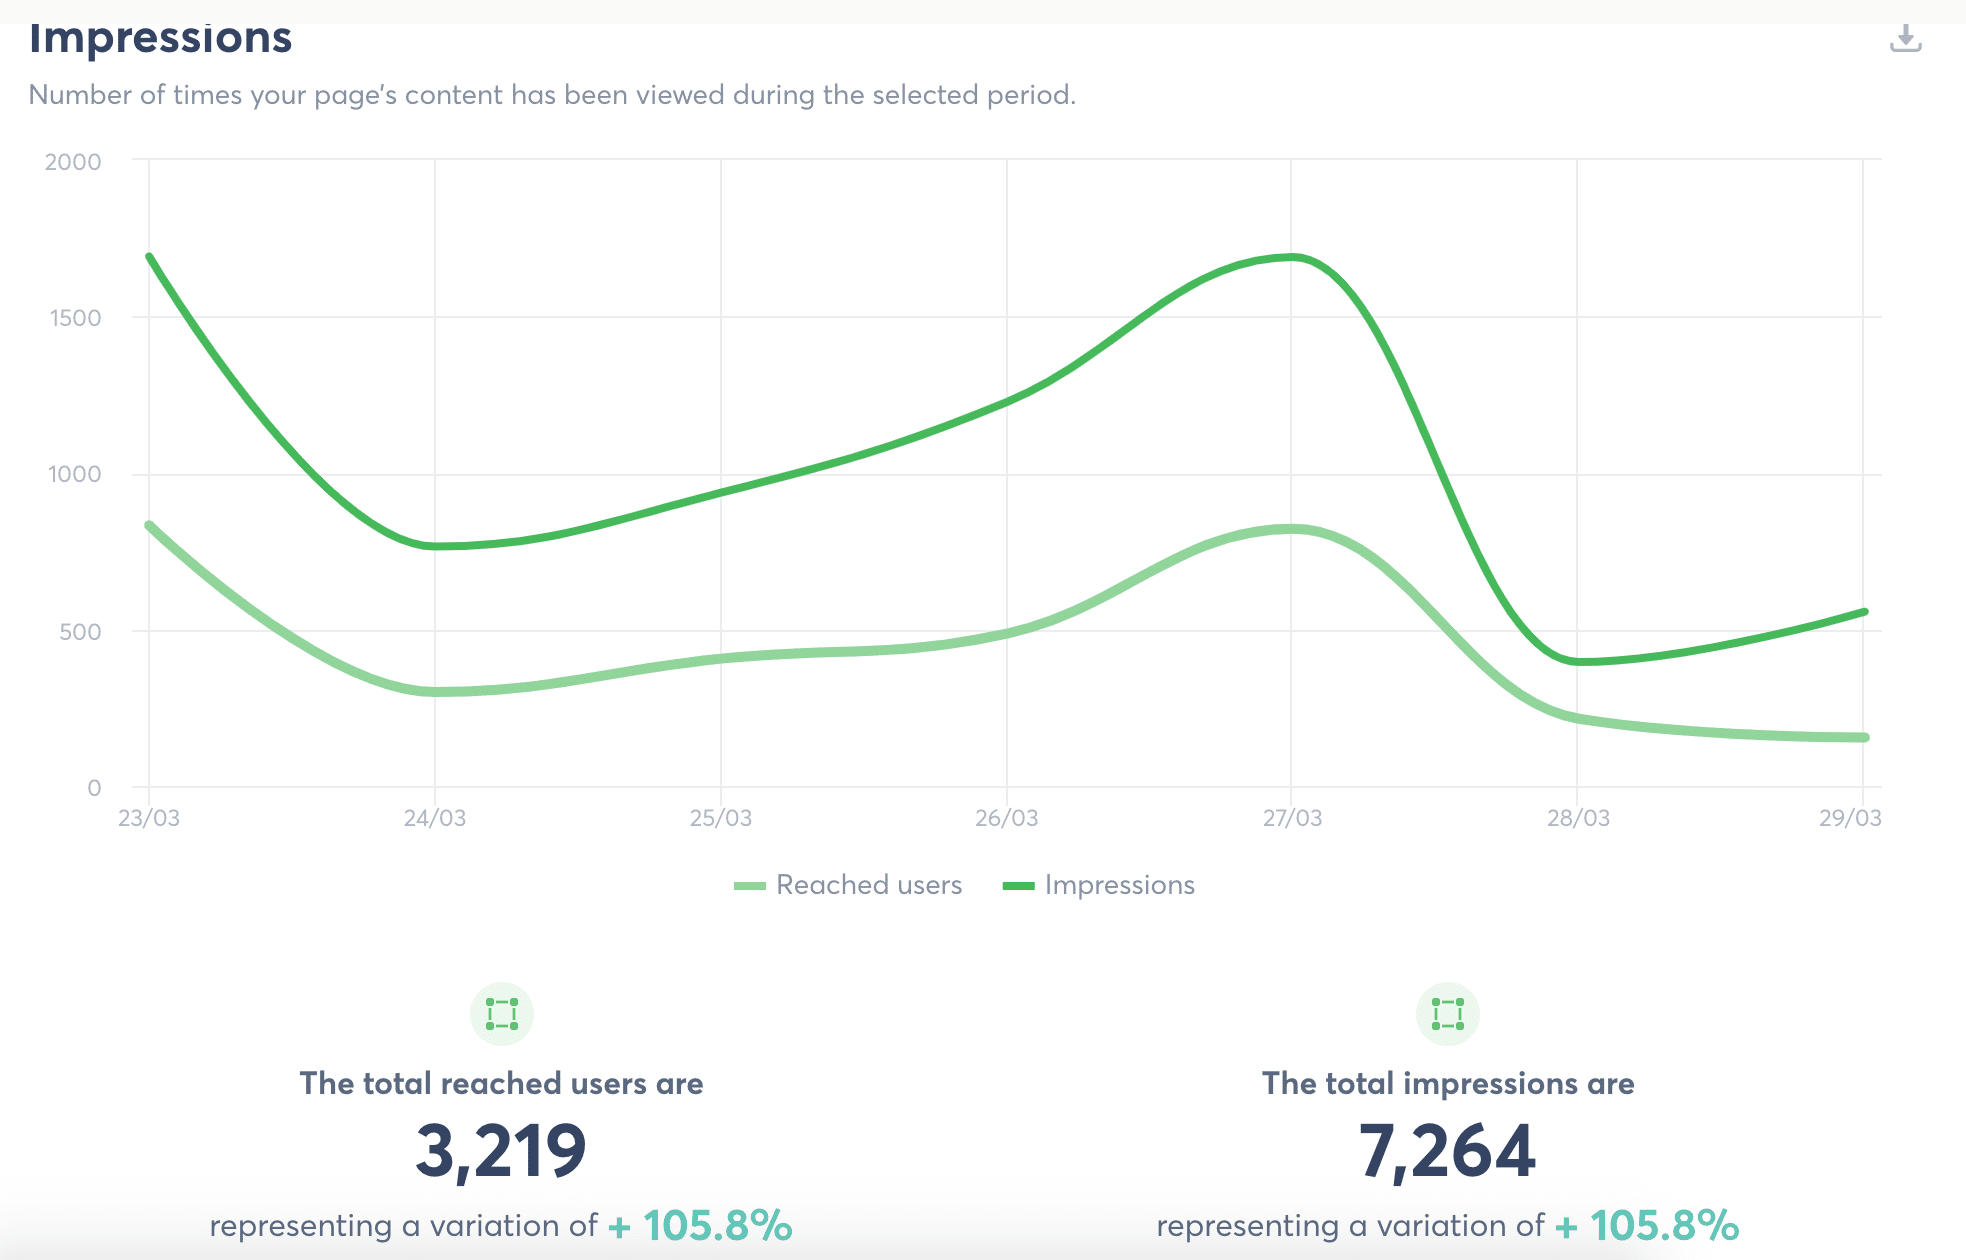 Number of impressions / total users reached by a Linkedin post
Marie, Content Manager
Keyword optimization in content
Why: to check if our SEO strategy (optimization for search engines) is good and to identify the articles or content that deserves a redesign to improve our natural referencing – or to see if our redesign has been effective.
Which tool: Ahrefs, Google Search Console
New leads generated by content
Why: we can check the quality of our content, whether it speaks to our personas and adjust content accordingly. We can also use it to gauge the effectiveness of our banners on social networks or sponsored campaigns.
Which tool: Plezi
To sum up, any indicator can be a vanity metric if you do nothing with it. Rather than following a multitude of indicators without really knowing why, select some of them in a relevant way and make them real decision-making tools.
Let us know what you think!


